What happens to baseball players whose career WARs have followed a certain trajectory? Projection systems give you an expectation for the upcoming year. I made a little tool to vizualize the recent past and near future for players similar to a comparison player of your choice.
I generally don’t have a good memory for events, but one that sticks with me is watching the Toronto Blue Jays on an old TV in my late great-grandmother’s smoke-filled apartment in 1993. I’m certainly not the only Canadian with such a memory. Despite the allure that Montreal would once hold in my mind, I never cared much for the Expos. Insofar as I have been a (very tenuous) baseball fan, I have cheered for the Blue Jays.
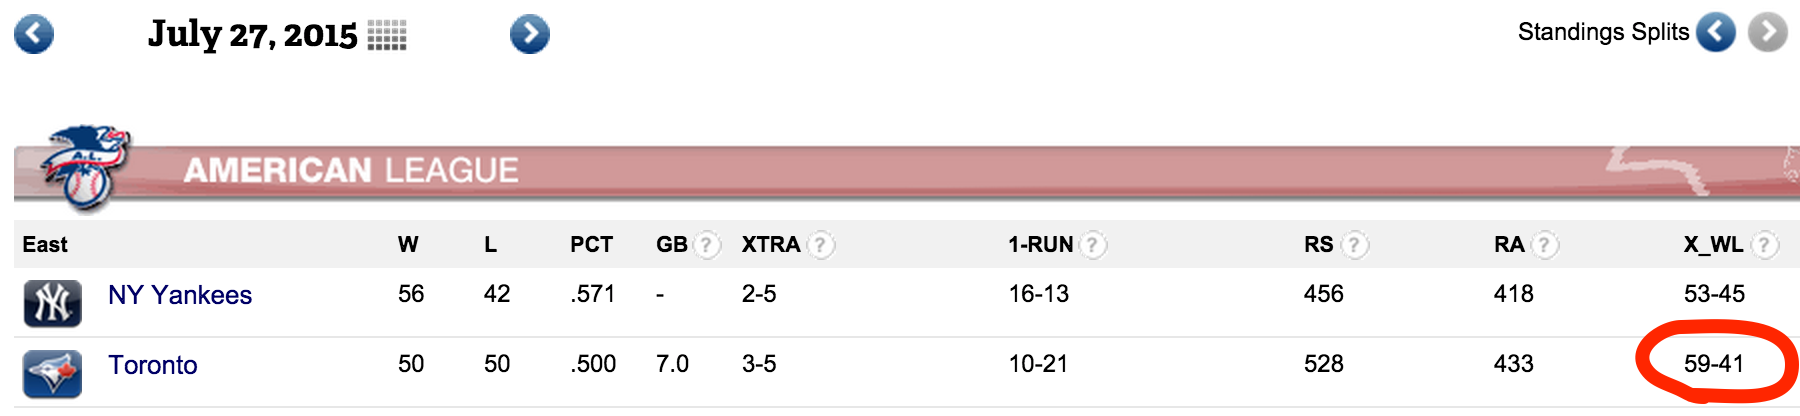
I’ve watched a lot of Jays games in my life, but truth be told, most of them were in previous decades. My memories are largely of guys like Carlos Delgado, Shawn Green, and Kelvim Escobar. In recent years, my interest in baseball has consisted of a periodic mid-summer check-in, usually to find the Blue Jays 7-10 games back of a playoff position with no hope of catching up. This summer’s check-in proceeded according to schedule. The Jays were their usual 7 games back, but…
I had previously seen these letters, ‘X_WL’, and knew they stood for ‘Expected Wins / Losses’. It means that a team that has scored 528 runs and allowed 433 should expect to have this record, without any particularly good or bad luck. The fact that the Blue Jays had a huge discrepancy between their actual record (50-50) and their expected record (59-41) either means they were very unlucky, or something else about their team makes them get all their runs at the wrong time. In other words, they beat up on teams, piling up the runs, but when they needed them most, they came up just short. Nevertheless, I had some hope. Shortly thereafter, they acquired some players at the trade deadline. After some simple Google queries, I found that these players were in fact “good”. So I started watching some games.
Now even at the best of times, baseball, the most coin-flippiest of sports, is not the most fun to watch. However, unlike my teenage self, I now posess (1) some knowledge of statistics, and (2) a laptop. So what once was annoying is now symbiotic.
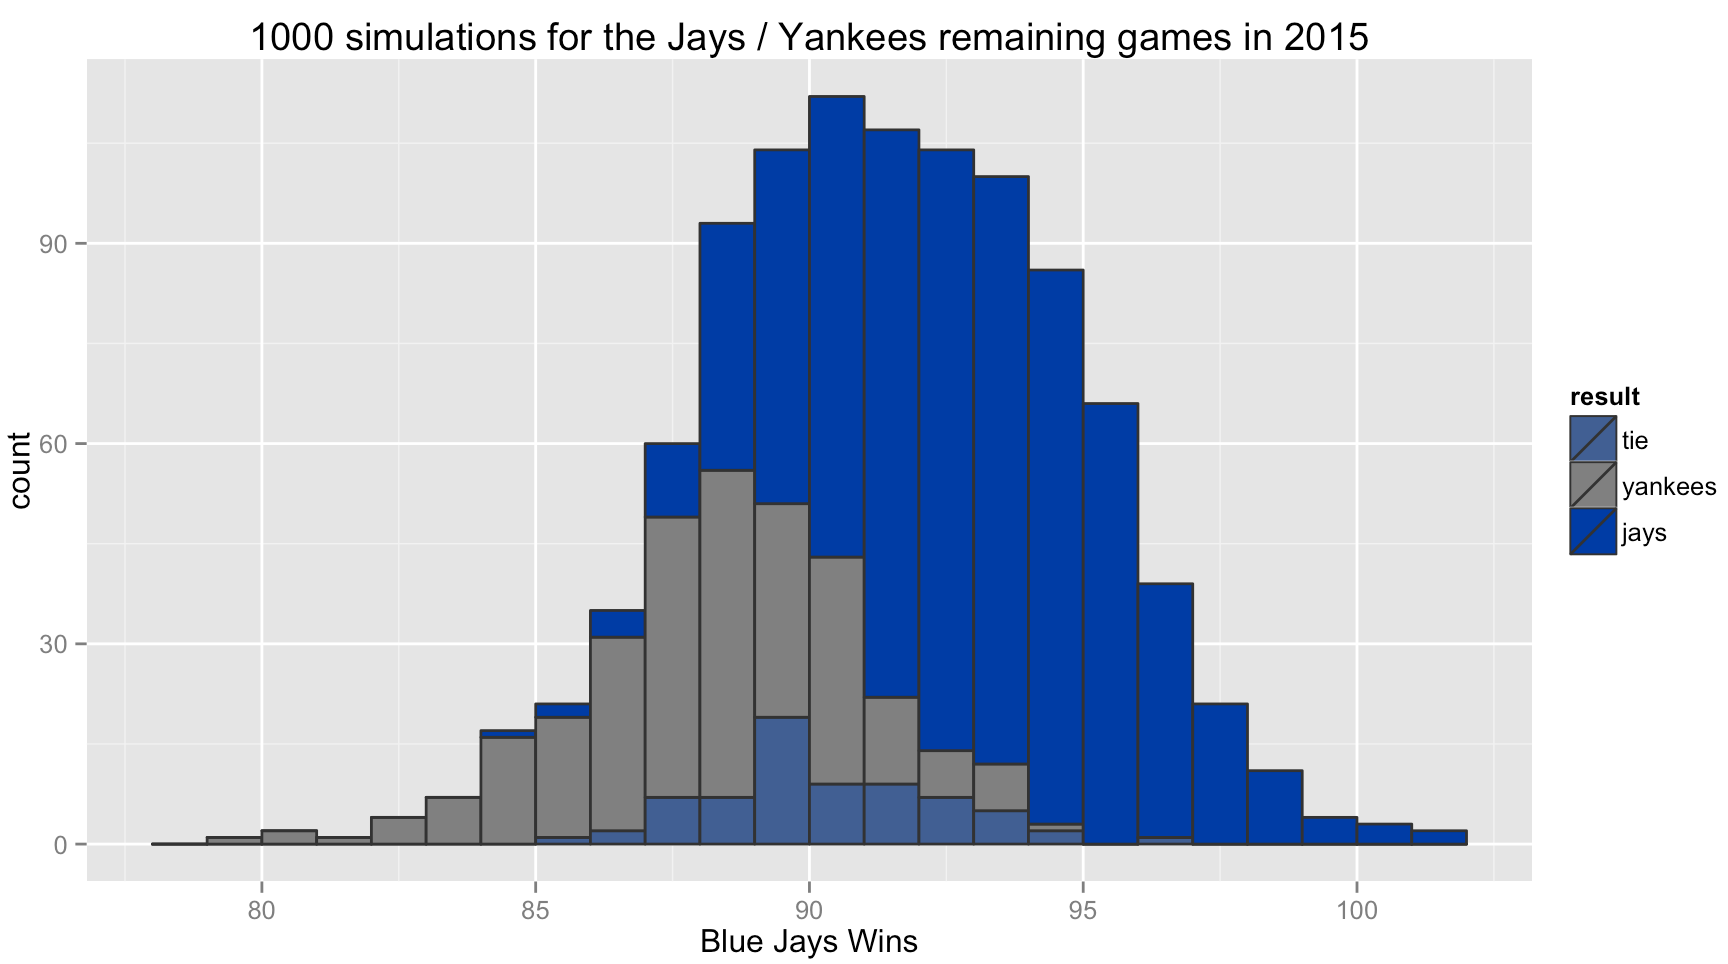
Okay, okay, so what I’m saying is this is motivated by my fandom, but I ran some a simple simulation for the rest of the MLB season for the Blue Jays and Yankees.
Assumptions:
Each team’s overall predicted winning percentage is a weighted combination of their actual winning percentage and their expected winning percentage
For each game, the predicted winning percentage against that particular opponent is determined using the Log5 formula
Game results are independent
I didn’t pay attention to home field advantage. It’s after midnight.
Results:
The Blue Jays’ predicted win probability (0.593) is higher than the Yankees (0.553). This difference alone would amount to 2 extra wins expected over 50 games.
Weighted by the number of games, the Yankees face slightly more difficult opposition (predicted win prob = 0.507) than the Blue Jays’s opposition (predicted win prob = 0.495).
The Blue Jays finish higher than the Yankees in 67% of simulations, lower than the Yankees in 26%, and they are tied in 7% of simulations.
Amongst those scenarios where they finish tied at the end of the season, the Blue Jays have home field advantage for the tiebreaker game 98% of the time (they are currently 7-2 against the Yankees).
Because I didn’t model the rest of the season for the other teams, I can’t necessarily translate these into Division / Wild Card probabilites, though it’s very likely that the Jays and Yankees finish 1-2 in the AL East (in some order)
Note: Betting markets are currently giving the Blue Jays an implied probability of 54.5 % and the Yankees an implied probability of 40% of winning the AL East.